Ask AI about Dom & Tom
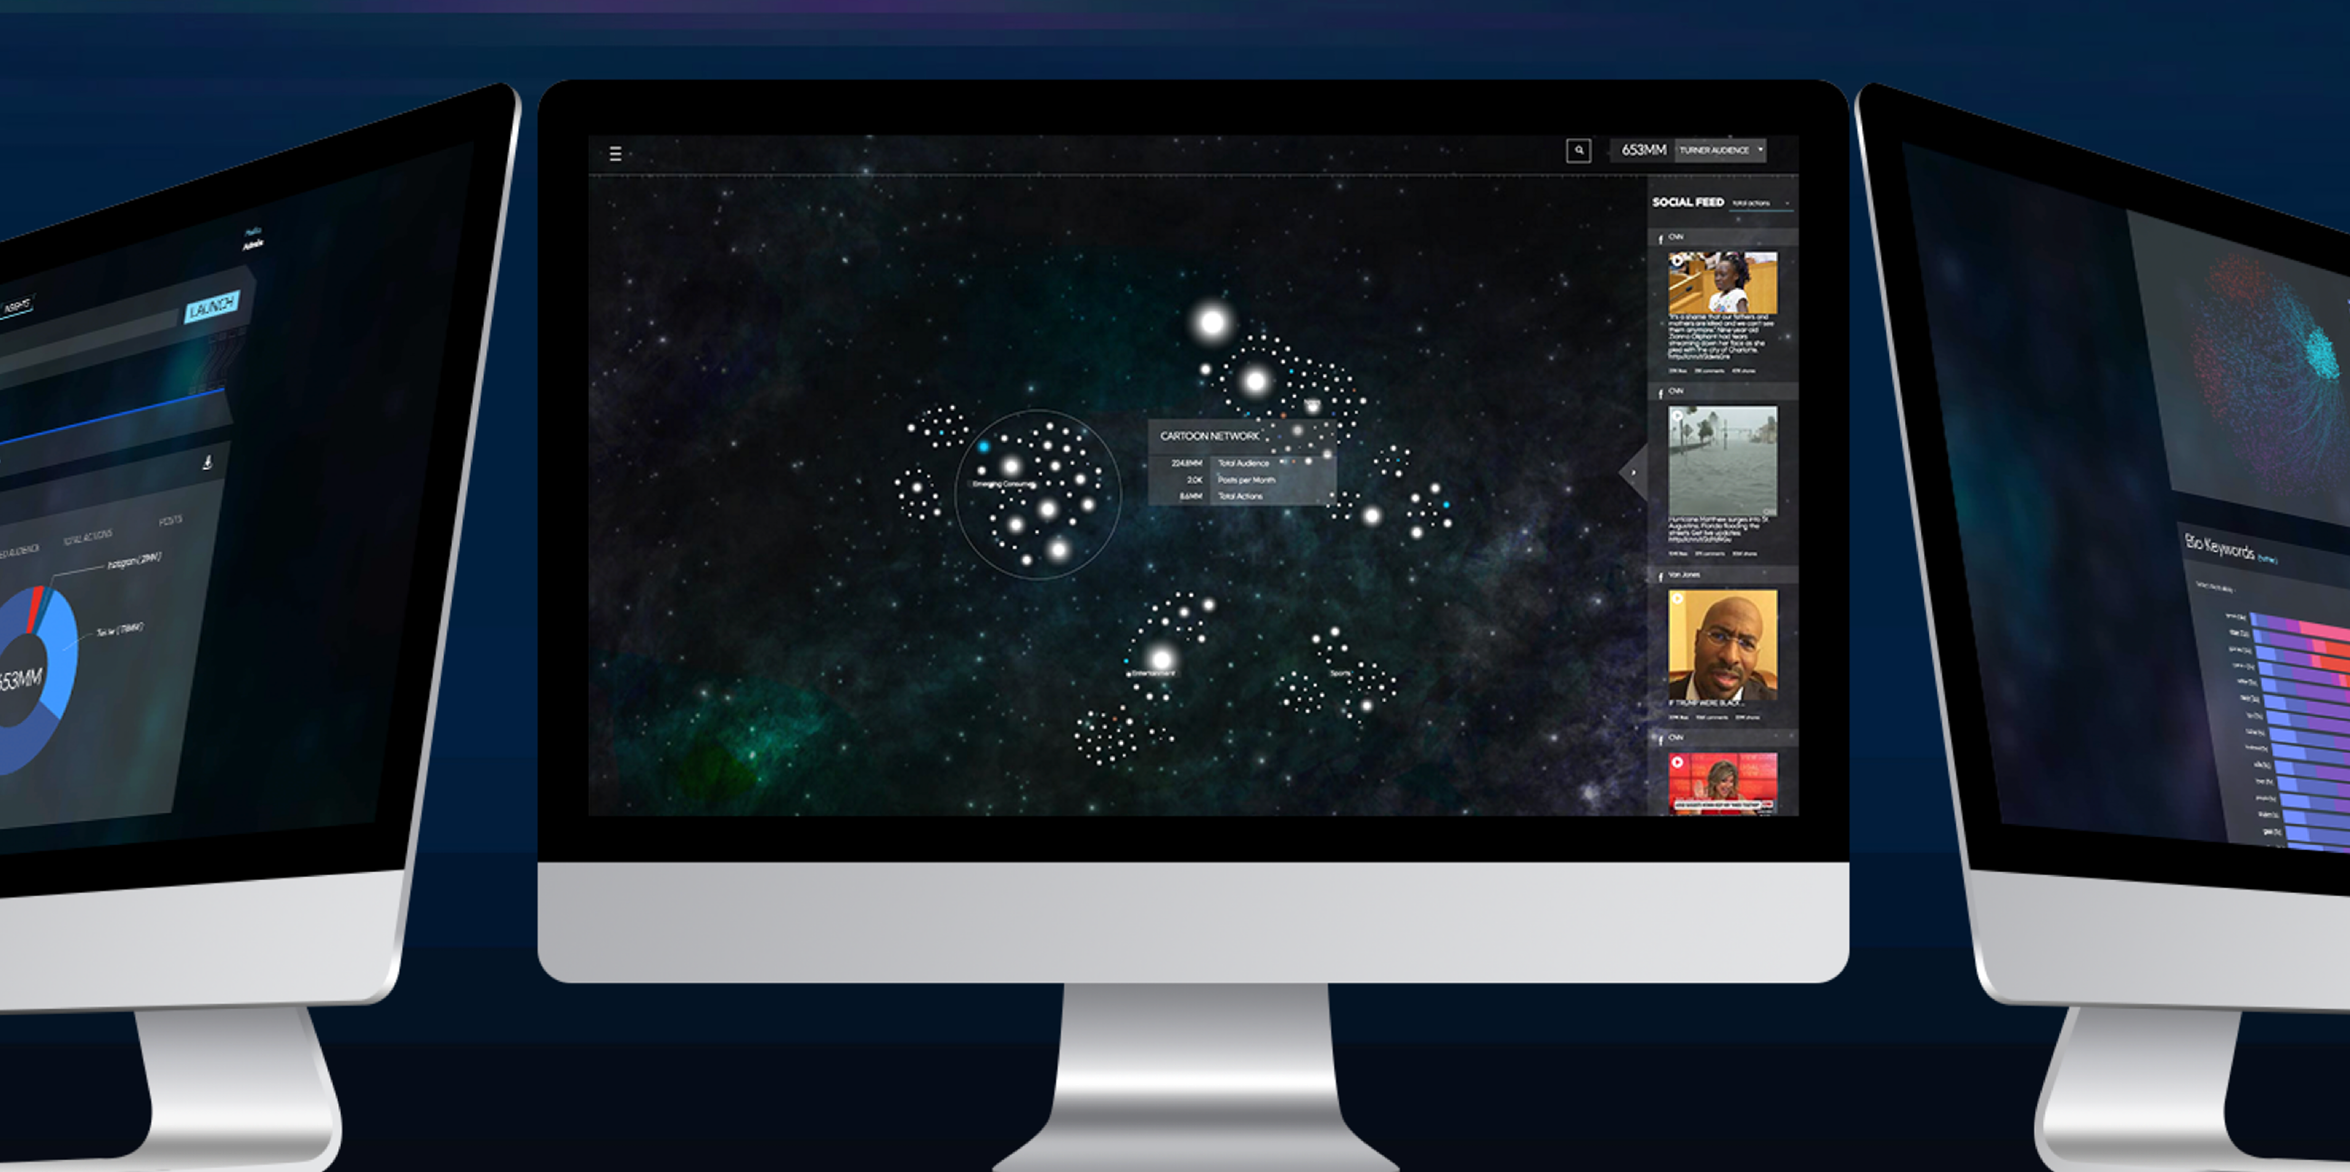
Turner Broadcasting Company Data Visualization
UX Design, Visual Design
Case study summary
- Client / industry
- Turner Broadcasting Company Data Visualization
- Problem
- UX Design, Visual Design
- What Dom & Tom did
- Product strategy, UX/UI, software engineering, QA, and launch support based on the documented case study scope.
- Relevant services
- Product strategyMobile app developmentWeb development
Turner (TimeWarner)Ad Data Platform for Social, Digital, TV
An enterprise real-time social analytics tool that helps marketers better monetize social conversations while empowering sales teams to sell to and service their clients.
The Challenge
Turner (Time Warner) sought to redefine how media is purchased and branded content is distributed across TV, social, and digital platforms. With aggressive deadlines, multiple stakeholders, and a vast array of proprietary and third-party data sources, Turner needed an enterprise-level real-time analytics tool that would enable marketers to better track social media performance, optimize ad campaigns, and drive business outcomes.
The Solution
Dom & Tom partnered with Turner to develop a first-of-its-kind data visualization platform that harnesses social, digital, and TV audience data to provide actionable insights for advertisers. This innovative tool identifies groups of like-minded users, tracks trending topics, and measures engagement across multiple platforms, empowering brands to create more impactful content. By integrating advanced social analytics and big data visualization, the platform helps advertisers make data-driven decisions, refine targeting strategies, and maximize return on investment.
As part of Turner’s broader digital advertising strategy, the platform integrates with Launchpad, Turner’s proprietary social optimization tool. Launchpad leverages insights from over 750 million global social followers across Turner’s 100+ social accounts, allowing advertisers to reach highly targeted audiences and drive measurable business results. With offerings such as interactive social commerce, branded video campaigns, and real-time engagement tracking, Turner’s advertising solutions continue to set new industry standards.
As part of Turner’s broader digital advertising strategy, the platform integrates with Launchpad, Turner’s proprietary social optimization tool. Launchpad leverages insights from over 750 million global social followers across Turner’s 100+ social accounts, allowing advertisers to reach highly targeted audiences and drive measurable business results. With offerings such as interactive social commerce, branded video campaigns, and real-time engagement tracking, Turner’s advertising solutions continue to set new industry standards.
Our Plan & Process
The process began with in-depth discovery sessions, which provided the Dom & Tom team with insight into the daily challenges facing the client. The team created a number of prototypes and minimum viable product concepts for company-wide buy-in. We then moved into MVP build-phase where we designed and developed the first release launched to the Turner team. For the following two years, we iterated, maintained, and grew the platform alongside Turner.
The Results
The impact was immediate. Within the first three months of launch, Turner’s data visualization platform powered over 100 successful campaigns, generating more than $10 million in new revenue. The tool’s ability to transform complex audience data into an intuitive and visually compelling experience helped brands optimize their media spend, improve ad performance, and drive consumer action.
Following its success, Turner expanded the platform internationally, equipping sales and marketing teams worldwide with the ability to execute high-performance branded content campaigns. Their data-driven approach continued to revolutionize advertising, positioning the company as a leader in the evolving landscape of digital media and social commerce.
As a result of the re-launch of the website, there was a 40% increase in user engagement after new UX checkout flows were implemented and a 15% decrease in page load times.
Following its success, Turner expanded the platform internationally, equipping sales and marketing teams worldwide with the ability to execute high-performance branded content campaigns. Their data-driven approach continued to revolutionize advertising, positioning the company as a leader in the evolving landscape of digital media and social commerce.
As a result of the re-launch of the website, there was a 40% increase in user engagement after new UX checkout flows were implemented and a 15% decrease in page load times.
Next Case Study
Continue exploring our work

Personalized Trials Platform for Columbia University Medical Center
Web Development, App Development, UX/UI Design
View Next Case Study
Frequently asked questions
What Dom & Tom capabilities does this highlight?
UX design, visual design, and product thinking for analytics, dashboards, and media or enterprise data experiences.
Why does data visualization need product design?
Data products fail when charts are accurate but unusable. UX and visual design clarify hierarchy, filters, labels, and workflows so teams can act on the data.
Can Dom & Tom help with internal analytics tools?
Yes. Dom & Tom supports dashboard UX, web interfaces, and engineering for internal tools and customer-facing analytics products.
What is the Turner Broadcasting data visualization case study?
Dom & Tom partnered with Turner Broadcasting on UX and visual design for data visualization—translating complex information into usable interfaces for stakeholders.
Ready to build something amazing?
Let's discuss your project and explore how we can help bring your vision to life.